Profiler
As the complexity of the application increases, performance issues such as low FPS and frequent cache misses causing lag may arise. LVGL has internally set up some hooks for performance measurement to help developers analyze and locate performance issues.
Introduction
LVGL has a built-in trace system to track and record the timestamps of important events that occur during runtime, such as rendering events and user input events. These event timestamps serve as important metrics for performance analysis.
The trace system has a configurable record buffer that stores the names of event functions and their timestamps. When the buffer is full, the trace system prints the log information through the provided user interface.
The output trace logs are formatted according to Android's systrace format and can be visualized using Perfetto.
Usage
Configure profiler
To enable the profiler, set LV_USE_PROFILER in lv_conf.h and configure the following options:
Enable the built-in profiler functionality by setting
LV_USE_PROFILER_BUILTIN.Buffer configuration: Set the value of
LV_PROFILER_BUILTIN_BUF_SIZEto configure the buffer size. A larger buffer can store more trace event information, reducing interference with rendering. However, it also results in higher memory consumption.Timestamp configuration: LVGL uses the
lv_tick_get()function with a precision of 1ms by default to obtain timestamps when events occur. Therefore, it cannot accurately measure intervals below 1ms. If your system environment can provide higher precision (e.g., 1us), you can configure the profiler as follows:
Recommended configuration in UNIX environments:
#include <sys/syscall.h>
#include <sys/types.h>
#include <time.h>

static uint32_t my_get_tick_us_cb(void)
{
    struct timespec ts;
    clock_gettime(CLOCK_MONOTONIC, &ts);
    return ts.tv_sec * 1000000 + ts.tv_nsec / 1000;
}

static int my_get_tid_cb(void)
{
    return (int)syscall(SYS_gettid);
}

static int my_get_cpu_cb(void)
{
    int cpu_id = 0;
    syscall(SYS_getcpu, &cpu_id, NULL);
    return cpu_id;
}

void my_profiler_init(void)
{
    lv_profiler_builtin_config_t config;
    lv_profiler_builtin_config_init(&config);
    config.tick_per_sec = 1000000; /* One second is equal to 1000000 microseconds */
    config.tick_get_cb = my_get_tick_us_cb;
    config.tid_get_cb = my_get_tid_cb;
    config.cpu_get_cb = my_get_cpu_cb;
    lv_profiler_builtin_init(&config);
}
Recommended configuration in Arduino environments:
void my_profiler_init(void)
{
    lv_profiler_builtin_config_t config;
    lv_profiler_builtin_config_init(&config);
    config.tick_per_sec = 1000000; /* One second is equal to 1000000 microseconds */
    config.tick_get_cb = micros; /* Use the microsecond time stamp provided by Arduino */
    lv_profiler_builtin_init(&config);
}
Log output configuration: LVGL uses the
LV_LOG()interface by default to output trace information. If you want to use another interface to output log information (e.g., file stream), you can redirect the log output using the following code:static void my_log_print_cb(const char * buf) { printf("%s", buf); } void my_profiler_init(void) { lv_profiler_builtin_config_t config; lv_profiler_builtin_config_init(&config); ... /* other configurations */ config.flush_cb = my_log_print_cb; lv_profiler_builtin_init(&config); }
Run the test scenario
Run the UI scenario that you want to measure, such as scrolling a scrollable page up and down or entering/exiting an application.
Process the logs
Save the output log as my_trace.txt, use trace_filter.py for filtering and preprocessing:
./lvgl/scripts/trace_filter.py my_trace.txtor
python3 ./lvgl/scripts/trace_filter.py my_trace.txt
You will obtain a processed text file named trace.systrace, which roughly contains the following content:
# tracer: nop
#
LVGL-1 [0] 2892.002993: tracing_mark_write: B|1|lv_timer_handler
LVGL-1 [0] 2892.002993: tracing_mark_write: B|1|_lv_display_refr_timer
LVGL-1 [0] 2892.003459: tracing_mark_write: B|1|refr_invalid_areas
LVGL-1 [0] 2892.003461: tracing_mark_write: B|1|lv_draw_rect
LVGL-1 [0] 2892.003550: tracing_mark_write: E|1|lv_draw_rect
LVGL-1 [0] 2892.003552: tracing_mark_write: B|1|lv_draw_rect
LVGL-1 [0] 2892.003556: tracing_mark_write: E|1|lv_draw_rect
LVGL-1 [0] 2892.003560: tracing_mark_write: B|1|lv_draw_rect
LVGL-1 [0] 2892.003573: tracing_mark_write: E|1|lv_draw_rect
...
Import the processed trace.systrace file into Perfetto and wait for it to be parsed.
Performance analysis
If the log parsing is successful, you will see the following screen:
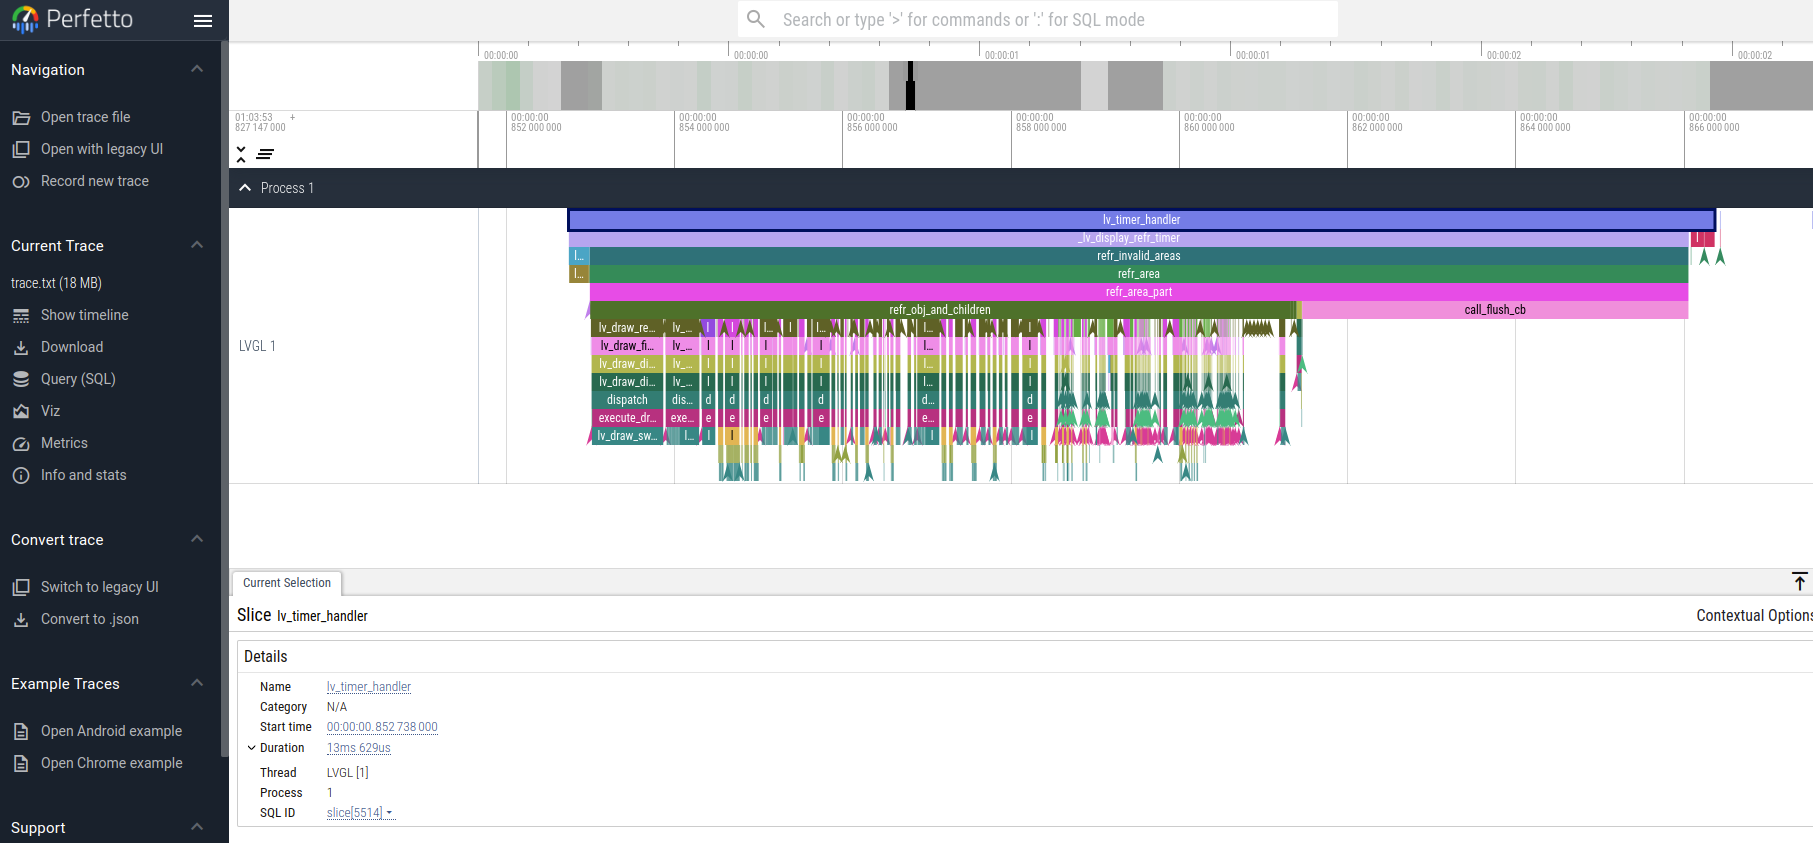
In the Perfetto UI, use the A or D keys to pan the timeline horizontally and the W or S keys to zoom in or out on the timeline. Use the mouse to move the focus and click on functions on the timeline to observe their execution time.
Add Measurement Point
Users can add their own measured functions:
void my_function_1(void)
{
    LV_PROFILER_BEGIN;
    do_something();
    LV_PROFILER_END;
}

void my_function_2(void)
{
    LV_PROFILER_BEGIN_TAG("do_something_1");
    do_something_1();
    LV_PROFILER_END_TAG("do_something_1");

    LV_PROFILER_BEGIN_TAG("do_something_2");
    do_something_2();
    LV_PROFILER_END_TAG("do_something_2");
}
Custom profiler implementation
If you wish to use a profiler method provided by your operating system, you can modify the following configurations in lv_conf.h:
LV_PROFILER_INCLUDE: Provides a header file for the profiler function.LV_PROFILER_BEGIN: Profiler start point function.LV_PROFILER_END: Profiler end point function.LV_PROFILER_BEGIN_TAG: Profiler start point function with custom tag.LV_PROFILER_END_TAG: Profiler end point function with custom tag.
Taking NuttX RTOS as an example:
#define LV_PROFILER_INCLUDE "nuttx/sched_note.h"
#define LV_PROFILER_BEGIN          sched_note_begin(NOTE_TAG_ALWAYS)
#define LV_PROFILER_END            sched_note_end(NOTE_TAG_ALWAYS)
#define LV_PROFILER_BEGIN_TAG(str) sched_note_beginex(NOTE_TAG_ALWAYS, str)
#define LV_PROFILER_END_TAG(str)   sched_note_endex(NOTE_TAG_ALWAYS, str)
FAQ
Perfetto log parsing fails
Please check the completeness of the logs. If the logs are incomplete, it may be due to the following reasons:
Serial port reception errors caused by a high baud rate. You need to reduce the baud rate.
Data corruption caused by other thread logs inserted during the printing of trace logs. You need to disable the log output of other threads or refer to the configuration above to use a separate log output interface.
Make sure that the string passed in by
LV_PROFILER_BEGIN_TAG/END_TAGis not a local variable on the stack or a string in shared memory, because currently only the string address is recorded and the content is not copied.
Function execution time displayed as 0s in Perfetto
If the function execution time is lower than the precision of the timestamps, this situation can occur. You can refer to the configuration instructions above to use a higher precision timestamp.
Significant stuttering occurs during profiling
When the buffer used to store trace events becomes full, the profiler will output all the data in the buffer, which can cause UI blocking and stuttering during the output. You can optimize this by taking the following measures:
Increase the value of
LV_PROFILER_BUILTIN_BUF_SIZE. A larger buffer can reduce the frequency of log printing, but it also consumes more memory.Optimize the execution time of log printing functions, such as increasing the serial port baud rate or improving file writing speed.
Trace logs are not being output
If the trace logs are not automatically printed when the buffer is not full, you can try the following methods to force the log output:
Reduce the value of
LV_PROFILER_BUILTIN_BUF_SIZEto fill the buffer more quickly and trigger automatic printing.Manually call or use a timer to call the
lv_profiler_builtin_flush()function to force the log output.