Chart (lv_chart)
Overview
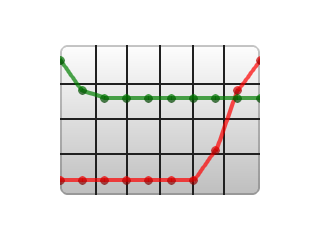
Charts consist of the following:
A background
Horizontal and vertical division lines
Data series, which can be represented with points, lines, columns, or filled areas.
Data series
You can add any number of series to the charts by lv_chart_add_series(chart, color).
It allocates data for a lv_chart_series_t structure which contains the chosen color and an array for the data points.
Series’ type
The following data display types exist:
LV_CHART_TYPE_NONE - Do not display any data. It can be used to hide a series.
LV_CHART_TYPE_LINE - Draw lines between the points.
LV_CHART_TYPE_COL - Draw columns.
LV_CHART_TYPE_POINT - Draw points.
LV_CHART_TYPE_AREA - Draw areas (fill the area below the lines).
LV_CHART_TYPE_VERTICAL_LINE - Draw only vertical lines to connect the points. Useful if the chart width is equal to the number of points, because it can redraw much faster than the
LV_CHART_TYPE_AREA.
You can specify the display type with lv_chart_set_type(chart, LV_CHART_TYPE_...). The types can be ‘OR’ed (like LV_CHART_TYPE_LINE | LV_CHART_TYPE_POINT).
Modify the data
You have several options to set the data of series:
Set the values manually in the array like
ser1->points[3] = 7and refresh the chart withlv_chart_refresh(chart).Use the
lv_chart_set_next(chart, ser, value).Initialize all points to a given value with:
lv_chart_init_points(chart, ser, value).Set all points from an array with:
lv_chart_set_points(chart, ser, value_array).
Use LV_CHART_POINT_DEF as value to make the library skip drawing that point, column, or line segment.
Update modes
lv_chart_set_next can behave in two ways depending on update mode:
LV_CHART_UPDATE_MODE_SHIFT - Shift old data to the left and add the new one o the right.
LV_CHART_UPDATE_MODE_CIRCULAR - Circularly add the new data (Like an ECG diagram).
The update mode can be changed with lv_chart_set_update_mode(chart, LV_CHART_UPDATE_MODE_...).
Number of points
The number of points in the series can be modified by lv_chart_set_point_count(chart, point_num). The default value is 10.
Vertical range
You can specify the minimum and maximum values in y-direction with lv_chart_set_range(chart, y_min, y_max). The value of the points will be scaled proportionally. The default range is: 0..100.
Division lines
The number of horizontal and vertical division lines can be modified by lv_chart_set_div_line_count(chart, hdiv_num, vdiv_num). The default settings are 3 horizontal and 5 vertical division lines.
Series’ appearance
To set the line width and point radius of the series, use the lv_chart_set_series_width(chart, size) function. The default value is 2.
The opacity of the data lines can be specified by lv_chart_set_series_opa(chart, opa). The default value is LV_OPA_COVER.
You can apply a dark color fade on the bottom of columns and points by lv_chart_set_series_darking(chart, effect) function. The default dark level is LV_OPA_50.
Tick marks and labels
Ticks and labels beside them can be added.
lv_chart_set_margin(chart, 20) needs to be used to add some extra space around the chart for the ticks and texts. Otherwise, you will not see them at all. You may need to adjust the number 20 depending on your requirements.
lv_chart_set_x_tick_text(chart, list_of_values, num_tick_marks, LV_CHART_AXIS_...) set the ticks and texts on x axis.
list_of_values is a string with '\n' terminated text (expect the last) with text for the ticks. E.g. const char * list_of_values = "first\nseco\nthird". list_of_values can be NULL.
If list_of_values is set then num_tick_marks tells the number of ticks between two labels. If list_of_values is NULL then it specifies the total number of ticks.
Major tick lines are drawn where text is placed, and minor tick lines are drawn elsewhere. lv_chart_set_x_tick_length(chart, major_tick_len, minor_tick_len) sets the length of tick lines on the x-axis.
The same functions exists for the y axis too: lv_chart_set_y_tick_text and lv_chart_set_y_tick_length.
Styles
You can set the styles with lv_chart_set_style(btn, LV_CHART_STYLE_MAIN, &style).
style.body - properties set the background’s appearance.
style.line - properties set the division lines’ appearance.
style.text - properties set the axis labels’ appearance.
Example
C
Line Chart
code
#include "lvgl/lvgl.h"

void lv_ex_chart_1(void)
{
    /*Create a chart*/
    lv_obj_t * chart;
    chart = lv_chart_create(lv_scr_act(), NULL);
    lv_obj_set_size(chart, 200, 150);
    lv_obj_align(chart, NULL, LV_ALIGN_CENTER, 0, 0);
    lv_chart_set_type(chart, LV_CHART_TYPE_POINT | LV_CHART_TYPE_LINE);   /*Show lines and points too*/
    lv_chart_set_series_opa(chart, LV_OPA_70);                            /*Opacity of the data series*/
    lv_chart_set_series_width(chart, 4);                                  /*Line width and point radious*/

    lv_chart_set_range(chart, 0, 100);

    /*Add two data series*/
    lv_chart_series_t * ser1 = lv_chart_add_series(chart, LV_COLOR_RED);
    lv_chart_series_t * ser2 = lv_chart_add_series(chart, LV_COLOR_GREEN);

    /*Set the next points on 'dl1'*/
    lv_chart_set_next(chart, ser1, 10);
    lv_chart_set_next(chart, ser1, 10);
    lv_chart_set_next(chart, ser1, 10);
    lv_chart_set_next(chart, ser1, 10);
    lv_chart_set_next(chart, ser1, 10);
    lv_chart_set_next(chart, ser1, 10);
    lv_chart_set_next(chart, ser1, 10);
    lv_chart_set_next(chart, ser1, 30);
    lv_chart_set_next(chart, ser1, 70);
    lv_chart_set_next(chart, ser1, 90);

    /*Directly set points on 'dl2'*/
    ser2->points[0] = 90;
    ser2->points[1] = 70;
    ser2->points[2] = 65;
    ser2->points[3] = 65;
    ser2->points[4] = 65;
    ser2->points[5] = 65;
    ser2->points[6] = 65;
    ser2->points[7] = 65;
    ser2->points[8] = 65;
    ser2->points[9] = 65;

    lv_chart_refresh(chart); /*Required after direct set*/
}
MicroPython
Line Chart
code
# Create a chart
chart = lv.chart(lv.scr_act())
chart.set_size(200, 150)
chart.align(None, lv.ALIGN.CENTER, 0, 0)
chart.set_type(lv.chart.TYPE.POINT | lv.chart.TYPE.LINE)   # Show lines and points too
chart.set_series_opa(lv.OPA._70)                           # Opacity of the data series
chart.set_series_width(4)                                  # Line width and point radious

chart.set_range(0, 100)

# Add two data series
ser1 = chart.add_series(lv.color_make(0xFF,0,0))
ser2 = chart.add_series(lv.color_make(0,0x80,0))

# Set points on 'dl1'
chart.set_points(ser1, [10, 10, 10, 10, 10, 10, 10, 30, 70, 90])

# Set points on 'dl2'
chart.set_points(ser2, [90, 70, 65, 65, 65, 65, 65, 65, 65, 65])
API
Typedefs
-
typedef uint8_t
lv_chart_type_t
-
typedef uint8_t
lv_chart_update_mode_t
-
typedef uint8_t
lv_chart_axis_options_t
-
typedef uint8_t
lv_chart_style_t
Enums
-
enum [anonymous]
Chart types
Values:
-
enumerator
LV_CHART_TYPE_NONE= 0x00¶ Don’t draw the series
-
enumerator
LV_CHART_TYPE_LINE= 0x01¶ Connect the points with lines
-
enumerator
LV_CHART_TYPE_COLUMN= 0x02¶ Draw columns
-
enumerator
LV_CHART_TYPE_POINT= 0x04¶ Draw circles on the points
-
enumerator
LV_CHART_TYPE_VERTICAL_LINE= 0x08¶ Draw vertical lines on points (useful when chart width == point count)
-
enumerator
LV_CHART_TYPE_AREA= 0x10¶ Draw area chart
-
enumerator
-
enum [anonymous]
Chart update mode for
lv_chart_set_nextValues:
-
enumerator
LV_CHART_UPDATE_MODE_SHIFT¶ Shift old data to the left and add the new one o the right
-
enumerator
LV_CHART_UPDATE_MODE_CIRCULAR¶ Add the new data in a circular way
-
enumerator
Functions
-
LV_EXPORT_CONST_INT(LV_CHART_POINT_DEF)
-
LV_EXPORT_CONST_INT(LV_CHART_TICK_LENGTH_AUTO)
-
lv_obj_t *
lv_chart_create(lv_obj_t *par, const lv_obj_t *copy)¶ Create a chart background objects
- Return
pointer to the created chart background
- Parameters
par: pointer to an object, it will be the parent of the new chart backgroundcopy: pointer to a chart background object, if not NULL then the new object will be copied from it
-
lv_chart_series_t *
lv_chart_add_series(lv_obj_t *chart, lv_color_t color)¶ Allocate and add a data series to the chart
- Return
pointer to the allocated data series
- Parameters
chart: pointer to a chart objectcolor: color of the data series
-
void
lv_chart_clear_serie(lv_obj_t *chart, lv_chart_series_t *serie)¶ Clear the point of a serie
- Parameters
chart: pointer to a chart objectserie: pointer to the chart’s serie to clear
-
void
lv_chart_set_div_line_count(lv_obj_t *chart, uint8_t hdiv, uint8_t vdiv)¶ Set the number of horizontal and vertical division lines
- Parameters
chart: pointer to a graph background objecthdiv: number of horizontal division linesvdiv: number of vertical division lines
-
void
lv_chart_set_range(lv_obj_t *chart, lv_coord_t ymin, lv_coord_t ymax)¶ Set the minimal and maximal y values
- Parameters
chart: pointer to a graph background objectymin: y minimum valueymax: y maximum value
-
void
lv_chart_set_type(lv_obj_t *chart, lv_chart_type_t type)¶ Set a new type for a chart
- Parameters
chart: pointer to a chart objecttype: new type of the chart (from ‘lv_chart_type_t’ enum)
-
void
lv_chart_set_point_count(lv_obj_t *chart, uint16_t point_cnt)¶ Set the number of points on a data line on a chart
- Parameters
chart: pointer r to chart objectpoint_cnt: new number of points on the data lines
-
void
lv_chart_set_series_opa(lv_obj_t *chart, lv_opa_t opa)¶ Set the opacity of the data series
- Parameters
chart: pointer to a chart objectopa: opacity of the data series
-
void
lv_chart_set_series_width(lv_obj_t *chart, lv_coord_t width)¶ Set the line width or point radius of the data series
- Parameters
chart: pointer to a chart objectwidth: the new width
-
void
lv_chart_set_series_darking(lv_obj_t *chart, lv_opa_t dark_eff)¶ Set the dark effect on the bottom of the points or columns
- Parameters
chart: pointer to a chart objectdark_eff: dark effect level (LV_OPA_TRANSP to turn off)
-
void
lv_chart_init_points(lv_obj_t *chart, lv_chart_series_t *ser, lv_coord_t y)¶ Initialize all data points with a value
- Parameters
chart: pointer to chart objectser: pointer to a data series on ‘chart’y: the new value for all points
-
void
lv_chart_set_points(lv_obj_t *chart, lv_chart_series_t *ser, lv_coord_t y_array[])¶ Set the value of points from an array
- Parameters
chart: pointer to chart objectser: pointer to a data series on ‘chart’y_array: array of ‘lv_coord_t’ points (with ‘points count’ elements )
-
void
lv_chart_set_next(lv_obj_t *chart, lv_chart_series_t *ser, lv_coord_t y)¶ Shift all data right and set the most right data on a data line
- Parameters
chart: pointer to chart objectser: pointer to a data series on ‘chart’y: the new value of the most right data
-
void
lv_chart_set_update_mode(lv_obj_t *chart, lv_chart_update_mode_t update_mode)¶ Set update mode of the chart object.
- Parameters
chart: pointer to a chart objectupdate: mode
-
void
lv_chart_set_style(lv_obj_t *chart, lv_chart_style_t type, const lv_style_t *style)¶ Set the style of a chart
- Parameters
chart: pointer to a chart objecttype: which style should be set (can be onlyLV_CHART_STYLE_MAIN)style: pointer to a style
-
void
lv_chart_set_x_tick_length(lv_obj_t *chart, uint8_t major_tick_len, uint8_t minor_tick_len)¶ Set the length of the tick marks on the x axis
- Parameters
chart: pointer to the chartmajor_tick_len: the length of the major tick orLV_CHART_TICK_LENGTH_AUTOto set automatically (where labels are added)minor_tick_len: the length of the minor tick,LV_CHART_TICK_LENGTH_AUTOto set automatically (where no labels are added)
-
void
lv_chart_set_y_tick_length(lv_obj_t *chart, uint8_t major_tick_len, uint8_t minor_tick_len)¶ Set the length of the tick marks on the y axis
- Parameters
chart: pointer to the chartmajor_tick_len: the length of the major tick orLV_CHART_TICK_LENGTH_AUTOto set automatically (where labels are added)minor_tick_len: the length of the minor tick,LV_CHART_TICK_LENGTH_AUTOto set automatically (where no labels are added)
-
void
lv_chart_set_secondary_y_tick_length(lv_obj_t *chart, uint8_t major_tick_len, uint8_t minor_tick_len)¶ Set the length of the tick marks on the secondary y axis
- Parameters
chart: pointer to the chartmajor_tick_len: the length of the major tick orLV_CHART_TICK_LENGTH_AUTOto set automatically (where labels are added)minor_tick_len: the length of the minor tick,LV_CHART_TICK_LENGTH_AUTOto set automatically (where no labels are added)
-
void
lv_chart_set_x_tick_texts(lv_obj_t *chart, const char *list_of_values, uint8_t num_tick_marks, lv_chart_axis_options_t options)¶ Set the x-axis tick count and labels of a chart
- Parameters
chart: pointer to a chart objectlist_of_values: list of string values, terminated with, except the last
num_tick_marks: if list_of_values is NULL: total number of ticks per axis else number of ticks between two value labelsoptions: extra options
-
void
lv_chart_set_secondary_y_tick_texts(lv_obj_t *chart, const char *list_of_values, uint8_t num_tick_marks, lv_chart_axis_options_t options)¶ Set the secondary y-axis tick count and labels of a chart
- Parameters
chart: pointer to a chart objectlist_of_values: list of string values, terminated with, except the last
num_tick_marks: if list_of_values is NULL: total number of ticks per axis else number of ticks between two value labelsoptions: extra options
-
void
lv_chart_set_y_tick_texts(lv_obj_t *chart, const char *list_of_values, uint8_t num_tick_marks, lv_chart_axis_options_t options)¶ Set the y-axis tick count and labels of a chart
- Parameters
chart: pointer to a chart objectlist_of_values: list of string values, terminated with, except the last
num_tick_marks: if list_of_values is NULL: total number of ticks per axis else number of ticks between two value labelsoptions: extra options
-
void
lv_chart_set_margin(lv_obj_t *chart, uint16_t margin)¶ Set the margin around the chart, used for axes value and ticks
- Parameters
chart: pointer to an chart objectmargin: value of the margin [px]
-
lv_chart_type_t
lv_chart_get_type(const lv_obj_t *chart)¶ Get the type of a chart
- Return
type of the chart (from ‘lv_chart_t’ enum)
- Parameters
chart: pointer to chart object
-
uint16_t
lv_chart_get_point_cnt(const lv_obj_t *chart)¶ Get the data point number per data line on chart
- Return
point number on each data line
- Parameters
chart: pointer to chart object
-
lv_opa_t
lv_chart_get_series_opa(const lv_obj_t *chart)¶ Get the opacity of the data series
- Return
the opacity of the data series
- Parameters
chart: pointer to chart object
-
lv_coord_t
lv_chart_get_series_width(const lv_obj_t *chart)¶ Get the data series width
- Return
the width the data series (lines or points)
- Parameters
chart: pointer to chart object
-
lv_opa_t
lv_chart_get_series_darking(const lv_obj_t *chart)¶ Get the dark effect level on the bottom of the points or columns
- Return
dark effect level (LV_OPA_TRANSP to turn off)
- Parameters
chart: pointer to chart object
-
const lv_style_t *
lv_chart_get_style(const lv_obj_t *chart, lv_chart_style_t type)¶ Get the style of an chart object
- Return
pointer to the chart’s style
- Parameters
chart: pointer to an chart objecttype: which style should be get (can be onlyLV_CHART_STYLE_MAIN)
-
struct
lv_chart_series_t
-
struct
lv_chart_axis_cfg_t
-
struct
lv_chart_ext_t¶ Public Members
-
lv_ll_t
series_ll
-
lv_coord_t
ymin
-
lv_coord_t
ymax
-
uint8_t
hdiv_cnt
-
uint8_t
vdiv_cnt
-
uint16_t
point_cnt
-
lv_chart_type_t
type
-
lv_chart_axis_cfg_t
y_axis
-
lv_chart_axis_cfg_t
x_axis
-
lv_chart_axis_cfg_t
secondary_y_axis
-
uint16_t
margin
-
uint8_t
update_mode
-
lv_coord_t
width
-
uint8_t
num
-
struct lv_chart_ext_t::[anonymous]
series
-
lv_ll_t