Chart (lv_chart)
Overview
Charts are a basic object to visualize data points. They support Line charts (connect points with lines and/or draw points on them) and Column charts.
Charts also support division lines, 2 y axis, axis ticks, and texts on ticks.
Parts and Styles
The Chart's main part is called LV_CHART_PART_BG and it uses all the typical background properties.
The text style properties determine the style of the axis texts and the line properties determine ticks' style.
Padding values add some space on the sides thus it makes the series area smaller. Padding also can be used to make space for axis texts and ticks.
The background of the series is called LV_CHART_PART_SERIES_BG and it's placed on the main background.
The division lines, and series data is drawn on this part. Besides the typical background style properties
the line style properties are used by the division lines. The padding values tells the space between the this part and the axis texts.
The style of the series can be referenced by LV_CHART_PART_SERIES. In case of column type the following properties are used:
radius: radius of the bars
padding_inner: space between the columns of the same x coordinate
In case of Line type these properties are used:
line properties to describe the lines
size radius of the points
bg_opa: the overall opacity of the area below the lines
bg_main_stop: % of bg_opa at the top to create an alpha fade (0: transparent at the top, 255: bg_opa at the top)
bg_grad_stop: % of bg_opa at the bottom to create an alpha fade (0: transparent at the bottom, 255: bg_opa at the top)
bg_drag_dir: should be
LV_GRAD_DIR_VERto allow alpha fading with bg_main_stop and bg_grad_stop
LV_CHART_PART_CURSOR refres to the cursors. Any number of cursor can be added and their appearence can be set by the line related style properties. The color of the cursors are set when the cursor is created and line_color fro mteh style is overwritten by this value.
Usage
Data series
You can add any number of series to the charts by lv_chart_add_series(chart, color).
It allocates data for a lv_chart_series_t structure which contains the chosen color and an array for the data points if
not using an external array, if an external array is assigned any internal points associated with the series are deallocated
and the series points to the external array instead.
Series' type
The following data display types exist:
LV_CHART_TYPE_NONE - Do not display any data. It can be used to hide the series.
LV_CHART_TYPE_LINE - Draw lines between the points.
LV_CHART_TYPE_COLUMN - Draw columns.
You can specify the display type with lv_chart_set_type(chart, LV_CHART_TYPE_...). The types can be 'OR'ed (like LV_CHART_TYPE_LINE).
Modify the data
You have several options to set the data of series:
Set the values manually in the array like
ser1->points[3] = 7and refresh the chart withlv_chart_refresh(chart).Use
lv_chart_set_point_id(chart, ser, value, id)where id is the index of the point you wish to update.Use the
lv_chart_set_next(chart, ser, value).Initialize all points to a given value with:
lv_chart_init_points(chart, ser, value).Set all points from an array with:
lv_chart_set_points(chart, ser, value_array).
Use LV_CHART_POINT_DEF as value to make the library skip drawing that point, column, or line segment.
Override default start point for series
If you wish a plot to start from a point other than the default which is point[0] of the series, you can set an alternative
index with the function lv_chart_set_x_start_point(chart, ser, id) where id is the new index position to start plotting from.
Set an external data source
You can make the chart series update from an external data source by assigning it with the function:
lv_chart_set_ext_array(chart, ser, array, point_cnt ) where array is an external array of lv_coord_t with point_cnt elements.
Note: you should call lv_chart_refresh(chart) after the external data source has been updated, to update the chart.
Get current chart information
There are four functions to get information about a chart:
lv_chart_get_type(chart)returns the current chart type.lv_chart_get_point_count(chart)returns the current chart point count.lv_chart_get_x_start_point(ser)returns the current plotting index for the specified series.lv_chart_get_point_id(chart, ser, id)returns the value of the data at a particular index(id) for the specified series.
Update modes
lv_chart_set_next can behave in two ways depending on update mode:
LV_CHART_UPDATE_MODE_SHIFT - Shift old data to the left and add the new one o the right.
LV_CHART_UPDATE_MODE_CIRCULAR - Circularly add the new data (Like an ECG diagram).
The update mode can be changed with lv_chart_set_update_mode(chart, LV_CHART_UPDATE_MODE_...).
Number of points
The number of points in the series can be modified by lv_chart_set_point_count(chart, point_num). The default value is 10.
Note: this also affects the number of points processed when an external buffer is assigned to a series.
Vertical range
You can specify the minimum and maximum values in y-direction with lv_chart_set_range(chart, y_min, y_max). The value of the points will be scaled proportionally. The default range is: 0..100.
Division lines
The number of horizontal and vertical division lines can be modified by lv_chart_set_div_line_count(chart, hdiv_num, vdiv_num). The default settings are 3 horizontal and 5 vertical division lines.
Tick marks and labels
Ticks and labels can be added to the axis.
lv_chart_set_x_tick_text(chart, list_of_values, num_tick_marks, LV_CHART_AXIS_...) set the ticks and texts on x axis.
list_of_values is a string with '\n' terminated text (expect the last) with text for the ticks. E.g. const char * list_of_values = "first\nsec\nthird". list_of_values can be NULL.
If list_of_values is set then num_tick_marks tells the number of ticks between two labels. If list_of_values is NULL then it specifies the total number of ticks.
Major tick lines are drawn where text is placed, and minor tick lines are drawn elsewhere. lv_chart_set_x_tick_length(chart, major_tick_len, minor_tick_len) sets the length of tick lines on the x-axis.
The same functions exists for the y axis too: lv_chart_set_y_tick_text and lv_chart_set_y_tick_length.
Cursor
A cursor can be added with lv_chart_cursor_t * c1 = lv_chart_add_cursor(chart, color, dir);. The possible values of dir LV_CHART_CURSOR_NONE/RIGHT/UP/LEFT/DOWN or their OR-ed values to tell in which direction(s) should the cursor be drawn.
lv_chart_set_cursor_point(chart, cursor, &point) sets the position of the cursor. point is a pointer to an lv_poin_t variable. E.g. lv_point_t point = {10, 20};. The point is relative to the series area of the chart.
The lv_coord_t p_index = lv_chart_get_nearest_index_from_coord(chart, x) tells which point index is to the closest to a X coordinate (relative to the series area). It can be used to snap the cursor to a point for example when the chart is clicked.
lv_chart_get_x_from_index(chart, series, id) and lv_chart_get_y_from_index(chart, series, id) tells the X and Y coordinate of a given point. It's useful to place the cursor to given point.
The current series area can be retrieved with lv_chart_get_series_area(chart, &area) where area is a pointer to an lv_area_t variable to store the result. The area has absolute coordinates.
Example
C
Line Chart
code
#include "../../../lv_examples.h"
#if LV_USE_CHART

void lv_ex_chart_1(void)
{
    /*Create a chart*/
    lv_obj_t * chart;
    chart = lv_chart_create(lv_scr_act(), NULL);
    lv_obj_set_size(chart, 200, 150);
    lv_obj_align(chart, NULL, LV_ALIGN_CENTER, 0, 0);
    lv_chart_set_type(chart, LV_CHART_TYPE_LINE);   /*Show lines and points too*/

    /*Add two data series*/
    lv_chart_series_t * ser1 = lv_chart_add_series(chart, LV_COLOR_RED);
    lv_chart_series_t * ser2 = lv_chart_add_series(chart, LV_COLOR_GREEN);

    /*Set the next points on 'ser1'*/
    lv_chart_set_next(chart, ser1, 10);
    lv_chart_set_next(chart, ser1, 10);
    lv_chart_set_next(chart, ser1, 10);
    lv_chart_set_next(chart, ser1, 10);
    lv_chart_set_next(chart, ser1, 10);
    lv_chart_set_next(chart, ser1, 10);
    lv_chart_set_next(chart, ser1, 10);
    lv_chart_set_next(chart, ser1, 30);
    lv_chart_set_next(chart, ser1, 70);
    lv_chart_set_next(chart, ser1, 90);

    /*Directly set points on 'ser2'*/
    ser2->points[0] = 90;
    ser2->points[1] = 70;
    ser2->points[2] = 65;
    ser2->points[3] = 65;
    ser2->points[4] = 65;
    ser2->points[5] = 65;
    ser2->points[6] = 65;
    ser2->points[7] = 65;
    ser2->points[8] = 65;
    ser2->points[9] = 65;

    lv_chart_refresh(chart); /*Required after direct set*/
}

#endif
code
#include "../../../lv_examples.h"
#if LV_USE_CHART
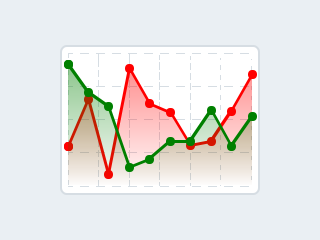
/**
* Add a faded area effect to the line chart
*/
void lv_ex_chart_2(void)
{
/*Create a chart*/
lv_obj_t * chart;
chart = lv_chart_create(lv_scr_act(), NULL);
lv_obj_set_size(chart, 200, 150);
lv_obj_align(chart, NULL, LV_ALIGN_CENTER, 0, 0);
lv_chart_set_type(chart, LV_CHART_TYPE_LINE); /*Show lines and points too*/
/*Add a faded are effect*/
lv_obj_set_style_local_bg_opa(chart, LV_CHART_PART_SERIES, LV_STATE_DEFAULT, LV_OPA_50); /*Max. opa.*/
lv_obj_set_style_local_bg_grad_dir(chart, LV_CHART_PART_SERIES, LV_STATE_DEFAULT, LV_GRAD_DIR_VER);
lv_obj_set_style_local_bg_main_stop(chart, LV_CHART_PART_SERIES, LV_STATE_DEFAULT, 255); /*Max opa on the top*/
lv_obj_set_style_local_bg_grad_stop(chart, LV_CHART_PART_SERIES, LV_STATE_DEFAULT, 0); /*Transparent on the bottom*/
/*Add two data series*/
lv_chart_series_t * ser1 = lv_chart_add_series(chart, LV_COLOR_RED);
lv_chart_series_t * ser2 = lv_chart_add_series(chart, LV_COLOR_GREEN);
/*Set the next points on 'ser1'*/
lv_chart_set_next(chart, ser1, 31);
lv_chart_set_next(chart, ser1, 66);
lv_chart_set_next(chart, ser1, 10);
lv_chart_set_next(chart, ser1, 89);
lv_chart_set_next(chart, ser1, 63);
lv_chart_set_next(chart, ser1, 56);
lv_chart_set_next(chart, ser1, 32);
lv_chart_set_next(chart, ser1, 35);
lv_chart_set_next(chart, ser1, 57);
lv_chart_set_next(chart, ser1, 85);
/*Directly set points on 'ser2'*/
ser2->points[0] = 92;
ser2->points[1] = 71;
ser2->points[2] = 61;
ser2->points[3] = 15;
ser2->points[4] = 21;
ser2->points[5] = 35;
ser2->points[6] = 35;
ser2->points[7] = 58;
ser2->points[8] = 31;
ser2->points[9] = 53;
lv_chart_refresh(chart); /*Required after direct set*/
}
#endif
MicroPython
Click to try in the simulator!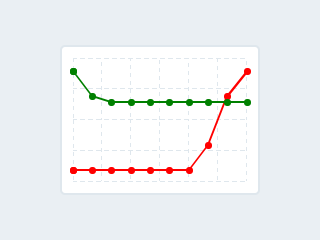
code
from lv_colors import lv_colors

# create a chart
chart = lv.chart(lv.scr_act(),None)
chart.set_size(200,150)
chart.align(None,lv.ALIGN.CENTER,0,0)
chart.set_type(lv.chart.TYPE.LINE)

ser1=chart.add_series(lv_colors.RED)
ser2=chart.add_series(lv_colors.GREEN)

# Set next points on ser1
chart.set_next(ser1,10)
chart.set_next(ser1,10)
chart.set_next(ser1,10)
chart.set_next(ser1,10)
chart.set_next(ser1,10)
chart.set_next(ser1,10)
chart.set_next(ser1,10)
chart.set_next(ser1,30)
chart.set_next(ser1,70)
chart.set_next(ser1,90)

# Set points on ser2
chart.set_points(ser2, [90, 70, 65, 65, 65, 65, 65, 65, 65, 65])
code
from lv_colors import lv_colors

# create a chart
chart = lv.chart(lv.scr_act(),None)
chart.set_size(200,150)
chart.align(None,lv.ALIGN.CENTER,0,0)
chart.set_type(lv.chart.TYPE.LINE)
# Add a faded are effect
chart.set_style_local_bg_opa(lv.chart.PART.SERIES, lv.STATE.DEFAULT, lv.OPA._50)               # Max. opa.
chart.set_style_local_bg_grad_dir(lv.chart.PART.SERIES, lv.STATE.DEFAULT, lv.GRAD_DIR.VER)
chart.set_style_local_bg_main_stop(lv.chart.PART.SERIES, lv.STATE.DEFAULT, 255)                # Max opa on the top
chart.set_style_local_bg_grad_stop(lv.chart.PART.SERIES, lv.STATE.DEFAULT, 0)                  # Transparent on the bottom

ser1=chart.add_series(lv_colors.RED)
ser2=chart.add_series(lv_colors.GREEN)

# Set next points on ser1
chart.set_next(ser1,31)
chart.set_next(ser1,66)
chart.set_next(ser1,10)
chart.set_next(ser1,89)
chart.set_next(ser1,63)
chart.set_next(ser1,56)
chart.set_next(ser1,32)
chart.set_next(ser1,35)
chart.set_next(ser1,57)
chart.set_next(ser1,85)

# Set points on ser2
chart.set_points(ser2, [92, 71, 61, 15, 21, 35, 35, 58, 31, 53])
API
Typedefs
-
typedef uint8_t
lv_chart_type_t
-
typedef uint8_t
lv_chart_update_mode_t
-
typedef uint8_t
lv_chart_axis_t
-
typedef uint8_t
lv_cursor_direction_t
-
typedef uint8_t
lv_chart_axis_options_t
Enums
-
enum [anonymous]
Chart types
Values:
-
enumerator
LV_CHART_TYPE_NONE¶ Don't draw the series
-
enumerator
LV_CHART_TYPE_LINE¶ Connect the points with lines
-
enumerator
LV_CHART_TYPE_COLUMN¶ Draw columns
-
enumerator
-
enum [anonymous]
Chart update mode for
lv_chart_set_nextValues:
-
enumerator
LV_CHART_UPDATE_MODE_SHIFT¶ Shift old data to the left and add the new one o the right
-
enumerator
LV_CHART_UPDATE_MODE_CIRCULAR¶ Add the new data in a circular way
-
enumerator
-
enum [anonymous]
Values:
-
enumerator
LV_CHART_AXIS_PRIMARY_Y
-
enumerator
LV_CHART_AXIS_SECONDARY_Y
-
enumerator
_LV_CHART_AXIS_LAST
-
enumerator
-
enum [anonymous]
Values:
-
enumerator
LV_CHART_CURSOR_NONE
-
enumerator
LV_CHART_CURSOR_RIGHT
-
enumerator
LV_CHART_CURSOR_UP
-
enumerator
LV_CHART_CURSOR_LEFT
-
enumerator
LV_CHART_CURSOR_DOWN
-
enumerator
Functions
-
LV_EXPORT_CONST_INT(LV_CHART_POINT_DEF)
-
LV_EXPORT_CONST_INT(LV_CHART_TICK_LENGTH_AUTO)
-
lv_obj_t *
lv_chart_create(lv_obj_t *par, const lv_obj_t *copy)¶ Create a chart background objects
- Parameters
par -- pointer to an object, it will be the parent of the new chart background
copy -- pointer to a chart background object, if not NULL then the new object will be copied from it
- Returns
pointer to the created chart background
-
lv_chart_series_t *
lv_chart_add_series(lv_obj_t *chart, lv_color_t color)¶ Allocate and add a data series to the chart
- Parameters
chart -- pointer to a chart object
color -- color of the data series
- Returns
pointer to the allocated data series
-
void
lv_chart_remove_series(lv_obj_t *chart, lv_chart_series_t *series)¶ Deallocate and remove a data series from a chart
- Parameters
chart -- pointer to a chart object
series -- pointer to a data series on 'chart'
-
lv_chart_cursor_t *
lv_chart_add_cursor(lv_obj_t *chart, lv_color_t color, lv_cursor_direction_t dir)¶ Add a cursor with a given color
- Parameters
chart -- pointer to chart object
color -- color of the cursor
dir -- direction of the cursor.
LV_CHART_CURSOR_RIGHT/LEFT/TOP/DOWN. OR-ed values are possible
- Returns
pointer to the created cursor
-
void
lv_chart_clear_series(lv_obj_t *chart, lv_chart_series_t *series)¶ Clear the point of a series
- Parameters
chart -- pointer to a chart object
series -- pointer to the chart's series to clear
-
void
lv_chart_hide_series(lv_obj_t *chart, lv_chart_series_t *series, bool hide)¶ Hide/Unhide a single series of a chart.
- Parameters
chart -- pointer to a chart object.
series -- pointer to a series object
hide -- true: hide the series
-
void
lv_chart_set_div_line_count(lv_obj_t *chart, uint8_t hdiv, uint8_t vdiv)¶ Set the number of horizontal and vertical division lines
- Parameters
chart -- pointer to a graph background object
hdiv -- number of horizontal division lines
vdiv -- number of vertical division lines
-
void
lv_chart_set_y_range(lv_obj_t *chart, lv_chart_axis_t axis, lv_coord_t ymin, lv_coord_t ymax)¶ Set the minimal and maximal y values on an axis
- Parameters
chart -- pointer to a graph background object
axis --
LV_CHART_AXIS_PRIMARY_YorLV_CHART_AXIS_SECONDARY_Yymin -- y minimum value
ymax -- y maximum value
-
void
lv_chart_set_type(lv_obj_t *chart, lv_chart_type_t type)¶ Set a new type for a chart
- Parameters
chart -- pointer to a chart object
type -- new type of the chart (from 'lv_chart_type_t' enum)
-
void
lv_chart_set_point_count(lv_obj_t *chart, uint16_t point_cnt)¶ Set the number of points on a data line on a chart
- Parameters
chart -- pointer r to chart object
point_cnt -- new number of points on the data lines
-
void
lv_chart_init_points(lv_obj_t *chart, lv_chart_series_t *ser, lv_coord_t y)¶ Initialize all data points with a value
- Parameters
chart -- pointer to chart object
ser -- pointer to a data series on 'chart'
y -- the new value for all points
-
void
lv_chart_set_points(lv_obj_t *chart, lv_chart_series_t *ser, lv_coord_t y_array[])¶ Set the value of points from an array
- Parameters
chart -- pointer to chart object
ser -- pointer to a data series on 'chart'
y_array -- array of 'lv_coord_t' points (with 'points count' elements )
-
void
lv_chart_set_next(lv_obj_t *chart, lv_chart_series_t *ser, lv_coord_t y)¶ Shift all data right and set the most right data on a data line
- Parameters
chart -- pointer to chart object
ser -- pointer to a data series on 'chart'
y -- the new value of the most right data
-
void
lv_chart_set_update_mode(lv_obj_t *chart, lv_chart_update_mode_t update_mode)¶ Set update mode of the chart object.
- Parameters
chart -- pointer to a chart object
update -- mode
-
void
lv_chart_set_x_tick_length(lv_obj_t *chart, uint8_t major_tick_len, uint8_t minor_tick_len)¶ Set the length of the tick marks on the x axis
- Parameters
chart -- pointer to the chart
major_tick_len -- the length of the major tick or
LV_CHART_TICK_LENGTH_AUTOto set automatically (where labels are added)minor_tick_len -- the length of the minor tick,
LV_CHART_TICK_LENGTH_AUTOto set automatically (where no labels are added)
-
void
lv_chart_set_y_tick_length(lv_obj_t *chart, uint8_t major_tick_len, uint8_t minor_tick_len)¶ Set the length of the tick marks on the y axis
- Parameters
chart -- pointer to the chart
major_tick_len -- the length of the major tick or
LV_CHART_TICK_LENGTH_AUTOto set automatically (where labels are added)minor_tick_len -- the length of the minor tick,
LV_CHART_TICK_LENGTH_AUTOto set automatically (where no labels are added)
-
void
lv_chart_set_secondary_y_tick_length(lv_obj_t *chart, uint8_t major_tick_len, uint8_t minor_tick_len)¶ Set the length of the tick marks on the secondary y axis
- Parameters
chart -- pointer to the chart
major_tick_len -- the length of the major tick or
LV_CHART_TICK_LENGTH_AUTOto set automatically (where labels are added)minor_tick_len -- the length of the minor tick,
LV_CHART_TICK_LENGTH_AUTOto set automatically (where no labels are added)
-
void
lv_chart_set_x_tick_texts(lv_obj_t *chart, const char *list_of_values, uint8_t num_tick_marks, lv_chart_axis_options_t options)¶ Set the x-axis tick count and labels of a chart
- Parameters
chart -- pointer to a chart object
list_of_values --
list of string values, terminated with
, except the last
num_tick_marks -- if list_of_values is NULL: total number of ticks per axis else number of ticks between two value labels
options -- extra options
-
void
lv_chart_set_secondary_y_tick_texts(lv_obj_t *chart, const char *list_of_values, uint8_t num_tick_marks, lv_chart_axis_options_t options)¶ Set the secondary y-axis tick count and labels of a chart
- Parameters
chart -- pointer to a chart object
list_of_values --
list of string values, terminated with
, except the last
num_tick_marks -- if list_of_values is NULL: total number of ticks per axis else number of ticks between two value labels
options -- extra options
-
void
lv_chart_set_y_tick_texts(lv_obj_t *chart, const char *list_of_values, uint8_t num_tick_marks, lv_chart_axis_options_t options)¶ Set the y-axis tick count and labels of a chart
- Parameters
chart -- pointer to a chart object
list_of_values --
list of string values, terminated with
, except the last
num_tick_marks -- if list_of_values is NULL: total number of ticks per axis else number of ticks between two value labels
options -- extra options
-
void
lv_chart_set_x_start_point(lv_obj_t *chart, lv_chart_series_t *ser, uint16_t id)¶ Set the index of the x-axis start point in the data array
- Parameters
chart -- pointer to a chart object
ser -- pointer to a data series on 'chart'
id -- the index of the x point in the data array
-
void
lv_chart_set_ext_array(lv_obj_t *chart, lv_chart_series_t *ser, lv_coord_t array[], uint16_t point_cnt)¶ Set an external array of data points to use for the chart NOTE: It is the users responsibility to make sure the point_cnt matches the external array size.
- Parameters
chart -- pointer to a chart object
ser -- pointer to a data series on 'chart'
array -- external array of points for chart
-
void
lv_chart_set_point_id(lv_obj_t *chart, lv_chart_series_t *ser, lv_coord_t value, uint16_t id)¶ Set an individual point value in the chart series directly based on index
- Parameters
chart -- pointer to a chart object
ser -- pointer to a data series on 'chart'
value -- value to assign to array point
id -- the index of the x point in the array
-
void
lv_chart_set_series_axis(lv_obj_t *chart, lv_chart_series_t *ser, lv_chart_axis_t axis)¶ Set the Y axis of a series
- Parameters
chart -- pointer to a chart object
ser -- pointer to series
axis --
LV_CHART_AXIS_PRIMARY_YorLV_CHART_AXIS_SECONDARY_Y
-
void
lv_chart_set_cursor_point(lv_obj_t *chart, lv_chart_cursor_t *cursor, lv_point_t *point)¶ Set the coordinate of the cursor with respect to the origin of series area of the chart.
- Parameters
chart -- pointer to a chart object.
cursor -- pointer to the cursor.
point -- the new coordinate of cursor relative to the series area
-
lv_chart_type_t
lv_chart_get_type(const lv_obj_t *chart)¶ Get the type of a chart
- Parameters
chart -- pointer to chart object
- Returns
type of the chart (from 'lv_chart_t' enum)
-
uint16_t
lv_chart_get_point_count(const lv_obj_t *chart)¶ Get the data point number per data line on chart
- Parameters
chart -- pointer to chart object
- Returns
point number on each data line
-
uint16_t
lv_chart_get_x_start_point(lv_chart_series_t *ser)¶ get the current index of the x-axis start point in the data array
- Parameters
ser -- pointer to a data series on 'chart'
- Returns
the index of the current x start point in the data array
-
lv_coord_t
lv_chart_get_point_id(lv_obj_t *chart, lv_chart_series_t *ser, uint16_t id)¶ Get an individual point value in the chart series directly based on index
- Parameters
chart -- pointer to a chart object
ser -- pointer to a data series on 'chart'
id -- the index of the x point in the array
- Returns
value of array point at index id
-
lv_chart_axis_t
lv_chart_get_series_axis(lv_obj_t *chart, lv_chart_series_t *ser)¶ Get the Y axis of a series
- Parameters
chart -- pointer to a chart object
ser -- pointer to series
- Returns
LV_CHART_AXIS_PRIMARY_YorLV_CHART_AXIS_SECONDARY_Y
-
void
lv_chart_get_series_area(lv_obj_t *chart, lv_area_t *series_area)¶ Get an individual point y value in the chart series directly based on index
- Parameters
chart -- pointer to a chart object
series_area -- pointer to an area variable that the result will put in.
-
lv_point_t
lv_chart_get_cursor_point(lv_obj_t *chart, lv_chart_cursor_t *cursor)¶ Get the coordinate of the cursor with respect to the origin of series area of the chart.
- Parameters
chart -- pointer to a chart object
cursor -- pointer to cursor
- Returns
coordinate of the cursor as lv_point_t
-
uint16_t
lv_chart_get_nearest_index_from_coord(lv_obj_t *chart, lv_coord_t x)¶ Get the nearest index to an X coordinate
- Parameters
chart -- pointer to a chart object
coord -- the coordination of the point relative to the series area.
- Returns
the found index
-
lv_coord_t
lv_chart_get_x_from_index(lv_obj_t *chart, lv_chart_series_t *ser, uint16_t id)¶ Get the x coordinate of the an index with respect to the origin of series area of the chart.
- Parameters
chart -- pointer to a chart object
ser -- pointer to series
id -- the index.
- Returns
x coordinate of index
-
lv_coord_t
lv_chart_get_y_from_index(lv_obj_t *chart, lv_chart_series_t *ser, uint16_t id)¶ Get the y coordinate of the an index with respect to the origin of series area of the chart.
- Parameters
chart -- pointer to a chart object
ser -- pointer to series
id -- the index.
- Returns
y coordinate of index
-
struct
lv_chart_series_t
-
struct
lv_chart_cursor_t
-
struct
lv_chart_axis_cfg_t
-
struct
lv_chart_ext_t¶ Public Members
-
lv_ll_t
series_ll
-
lv_ll_t
cursors_ll
-
lv_coord_t
ymin[_LV_CHART_AXIS_LAST]
-
lv_coord_t
ymax[_LV_CHART_AXIS_LAST]
-
uint8_t
hdiv_cnt
-
uint8_t
vdiv_cnt
-
uint16_t
point_cnt
-
lv_style_list_t
style_series_bg
-
lv_style_list_t
style_series
-
lv_style_list_t
style_cursors
-
lv_chart_type_t
type
-
lv_chart_axis_cfg_t
y_axis
-
lv_chart_axis_cfg_t
x_axis
-
lv_chart_axis_cfg_t
secondary_y_axis
-
uint8_t
update_mode
-
lv_ll_t